.png)
John Paul College - One visual boards need to manage psychosocial risk
How John Paul College uses the radar graph to drive clarity, governance, and compliance
The Problem
For John Paul College, addressing psychosocial risk wasn’t the primary challenge, it was tracking it in a clear, aligned way.
For Kylie Oddy, Head of HR, lack of visibility is a key governance risk. Without it, leadership can't be sure that what is being done is effective and cannot demonstrate due diligence.
“We knew we had great work happening around wellbeing,” said Kylie,
“but we didn’t have a way to consistently measure and visualise where we were at across different psychosocial risk areas.”
As legislation evolved, the leadership team needed more than anecdotal feedback or scattered survey results. They needed one visual that could support:
- Identification and assessment of risks in line with the 17 psychosocial hazards,
- Meeting of legal expectations under the Model WHS Code of Practice, and
- Clear communication of risk insights to ensure leadership oversight and good governance
Skodel solution - Skodel’s psychosocial hazard radar graph
John Paul College implemented a short, staff consultation survey aligned to the psychosocial hazards in the WHS Code. Kylie was able to customise the questions to be specific to their context, however, what made the approach stand out was the radar graph at the centre of the process.
“The radar graph is exactly what we needed, it pulls everything together in a single visual and helps the executive team focus on the right conversations.” Kylie said.
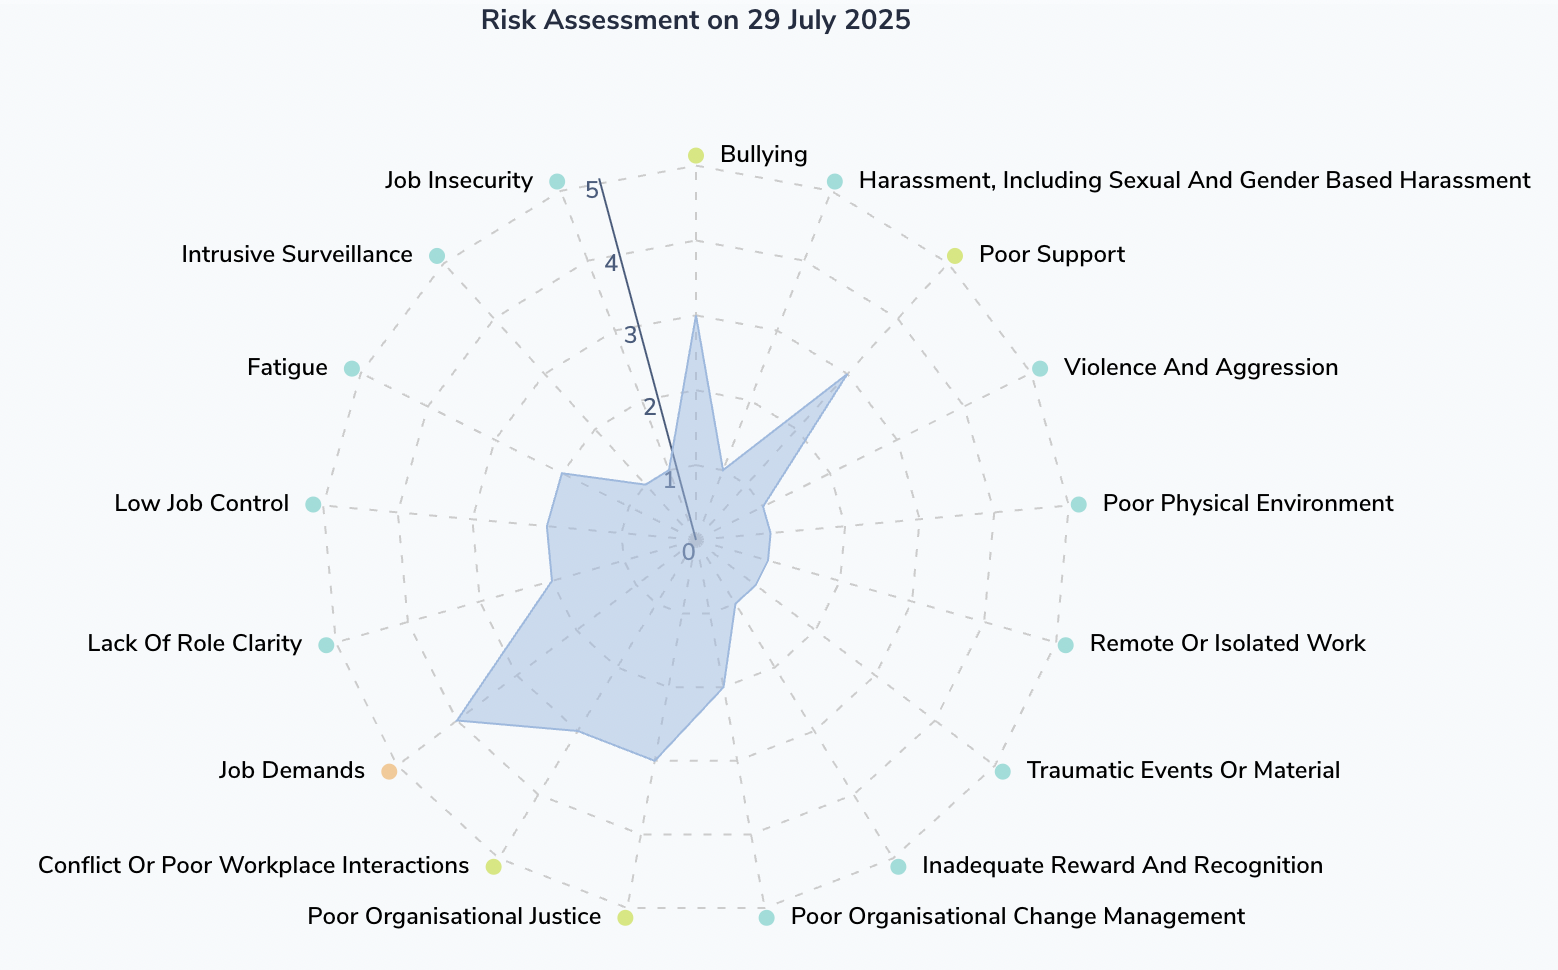
The radar graph:
- Presents each hazard domain (e.g. job demands, role clarity, work relationships) on a consistent scale,
- Highlights where risk levels are low, moderate or high,
- Makes it easy to track progress over time as controls are implemented.
Because the consultation takes just 2–4 minutes for staff, participation is high and the data quality meaningful.
Managing risks in consultation with staff
As part of the process, staff are invited to suggest controls they believe would reduce the risk. This means where there are elevated risks, staff suggestions feed directly into the school’s prevention planning. The result is a consultative approach to managing psychosocial risk, one that values and trusts staff input.
The results
With the radar graph in place, John Paul College has been able to:
- Establish a baseline view of psychosocial risk across the school,
- Prioritise controls in areas of higher risk in consultation with staff,
- Provide evidence of consultation and action for governance and compliance reporting,
- Guide board and leadership conversations using clear, consistent data.
“It’s changed the way we talk about psychosocial risk, good governance is no longer vague or hard to define. Everyone can see what’s happening and what needs to be done.” Kylie said.
.png)
.png)
.png)